

At the beginning of July, City Power’s 2026/27 electricity tariffs came into effect. For many business and high-usage customers, the key increase to plan around is 9.01%. This applies to categories such as Large Power Users, Business SPU customers, agricultural customers, and commercial and residential resellers. City Power’s overall average increase is reported as 8.63%, but for many commercial customers, the 9.01% category increase is the more relevant number to understand (City Power Johannesburg SOC Ltd, 2026; Roodepoort Record, 2026, The Citizen).
For businesses that use a lot of electricity, this is not just another percentage increase. It affects the cost of running refrigeration, HVAC, pumps, motors, compressors, ovens, lighting, production equipment and other essential loads every day.
The tariff increase did not create inefficient energy usage, demand spikes or unnecessary after-hours consumption. But it does make those problems more expensive.
That is why the more useful question is not only, “Why is electricity getting more expensive?”
It is, “Do we know why our business is paying what it is paying for electricity?”
When electricity prices increase, most businesses look at total consumption first. That matters, but it is only one part of the picture.
For many commercial and industrial sites, the electricity bill is also affected by when energy is used, how high demand peaks, which equipment runs at the same time, and whether loads are being managed efficiently.
A business may be paying more because of the tariff increase. It may also be paying more because large loads are starting together, equipment is running after hours, refrigeration is working harder than expected, or demand peaks are not being managed.
The monthly bill shows the result. It does not always show the reason.
This is where monitoring becomes valuable. The Carbon Trust explains that metering and monitoring help businesses track energy use, quantify savings over time, support energy-efficiency decisions and identify maintenance issues that may otherwise go unnoticed (Carbon Trust, 2019).
In simple terms: you cannot manage what you cannot see.
A business cannot control the City Power tariff. What it can influence is how electricity is used on site.
That includes:
This is where live and historical power data becomes useful.
The Power Cube, connected to Polar Cloud, gives a site visibility into its power usage, demand behaviour and operating patterns over time. It does not reduce costs by itself, and it does not replace good operational decisions. It helps provide the data needed to understand what is happening behind the bill.
The goal is not to switch equipment off blindly.
The goal is to manage loads with intent.
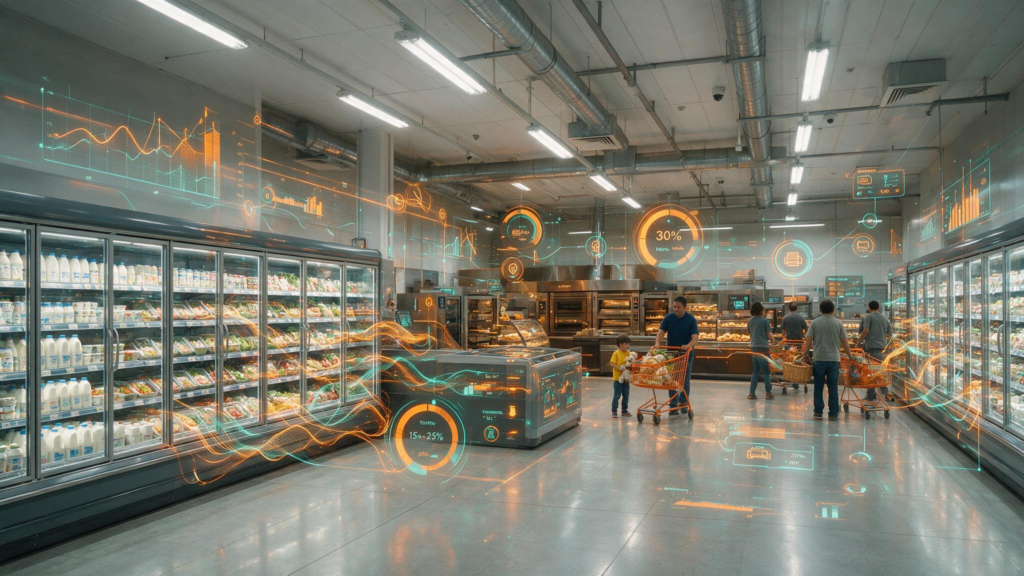
Supermarkets are a clear example of why energy monitoring matters.
They operate for long hours, rely on refrigeration around the clock, and often have several high-load systems running at the same time. In the South African food retail environment, the biggest energy users are typically refrigeration, lighting, HVAC and bakery equipment.
Supermarket & Retailer notes that refrigeration and HVAC can account for 30% to 60% of a store’s total energy consumption, while lighting can account for 15% to 25%. The same article highlights that stores need to understand how much electricity they are using, when they are using it, and where it is being used (Supermarket & Retailer, 2021).
An example can be seen in the SUPERSPAR Despatch energy-efficiency case study. The store is a supermarket in Despatch, Eastern Cape, that faced rising electricity costs and high energy demand from systems such as HVAC, bakery equipment and freezers. Its energy strategy included a baseline energy audit, sub-metering, tariff optimisation, real-time monitoring and targeted upgrades (Spacewell, 2023, CaseStudies).
The project reported a 24% reduction in total energy costs, an 8% saving from tariff optimisation, and a 50% reduction in bakery energy use, resulting in a 57% cost reduction in that area. These results came from a broader energy-management approach, not monitoring alone, but they show the value of understanding where energy is being used and then acting on that data (Spacewell, 2023).
To show why this matters in practical terms, let us use a simplified South African supermarket example.
This is an illustrative example only. It is not the actual SUPERSPAR Despatch bill or consumption profile. It applies City Power’s 2026/27 Large Customer Demand LV tariff structure to a high-usage supermarket-style load profile.
| Item | Example assumption |
|---|---|
| Store type | South African supermarket |
| Store size | 2,000 m² |
| Monthly electricity consumption | 100,000 kWh |
| Maximum demand | 300 kVA |
| Tariff example | City Power Large Customer Demand LV |
| Month used | Winter tariff example |
| VAT | Excluded |
City Power’s FY2026/27 tariff schedule lists the Large Customer Demand LV winter energy charge at 333.79 c/kWh, the demand charge at R461.22/kVA, the monthly service charge at R1,527.71, and the monthly capacity charge at R2,332.96. The tariff report also refers to the continued 6c/kWh network surcharge and 2% surcharge on Business and Large Power User customers, excluding VAT (City of Johannesburg SOC Ltd, 2026).
Using those assumptions, the estimated monthly electricity cost could look like this:
| Cost component | Example calculation | Estimated cost excl. VAT |
|---|---|---|
| Energy charge | 100,000 kWh × R3.3379/kWh | R333,790 |
| Network surcharge | 100,000 kWh × R0.06/kWh | R6,000 |
| Demand charge | 300 kVA × R461.22/kVA | R138,366 |
| Service + capacity charges | R1,527.71 + R2,332.96 | R3,860.67 |
| 2% Business / LPU surcharge | Approx. 2% of pre-VAT charges | ±R9,640 |
| Estimated monthly total | ±R491,657 excl. VAT |
For a supermarket, this cost is not driven by one single piece of equipment. It is the combined result of refrigeration, HVAC, lighting, bakery loads, back-of-house systems and operating behaviour across the month.
That is why the monthly bill is not enough.
The bill shows what was charged. Monitoring helps show what happened.
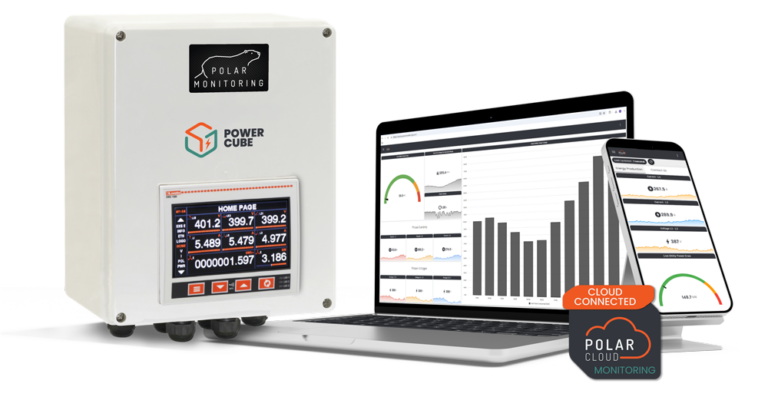
The Power Cube, connected to Polar Cloud, helps a supermarket see what is happening behind the bill.
It can help identify when demand peaks occur, whether large loads are starting together, whether equipment is running after hours, and whether changes made on site are actually reducing electricity usage over time.
In a supermarket environment, this could help answer practical questions such as:
These are the kinds of questions that turn energy monitoring into operational action.
Using the same example, even small improvements can have a meaningful impact.
If monitoring helps the business identify and reduce unnecessary electricity consumption by 5%, that equals 5,000 kWh per month. Using the City Power winter energy rate, the 6c/kWh network surcharge and the 2% Business/LPU surcharge, that could avoid roughly R17,300 per month in energy-related costs.
If the same site also reduces maximum demand by 25 kVA through better load scheduling or operational changes, it could avoid roughly R11,800 per month in demand-related costs.
Together, that could represent approximately R29,000 per month, or about R349,000 per year.
These are not guaranteed savings. The outcome depends on the site, the tariff, the equipment, the load profile and the actions taken. The point is that once tariffs increase, every avoidable kilowatt-hour and every avoidable demand spike becomes more expensive.
City Power tariffs are up, and many businesses are now starting to see the impact in their monthly bills.
The bill can show what you owe. It cannot always show why.
For high-usage businesses, the next step is to understand the loads behind the cost: when they run, how they behave, when demand peaks, and where avoidable usage may be hiding.
The Power Cube, connected to Polar Cloud, helps provide that visibility. It gives businesses a practical way to see live and historical power data, understand load behaviour and make better energy decisions based on facts instead of assumptions.
Electricity is getting more expensive.
Guesswork is getting more costly.
Smarter energy monitoring starts with visibility.
Carbon Trust. (2019). Effective energy management for business. Used for the explanation that metering and monitoring help businesses track energy use, quantify savings, support energy-efficiency decisions and identify maintenance issues. Carbon Trust
City Power Johannesburg SOC Ltd. (2026). Amendment of Tariff Charges for Electricity Services: 2026/27 / Approved tariff information. Used for City Power’s 2026/27 tariff context and the tariff components used in the illustrative supermarket calculation. City of Johannesburg
Roodepoort Record. (2026). City Power implements 8.63% average electricity tariff increase. Used for City Power’s reported 8.63% overall average increase and the 9.01% increases listed for most customer categories, including Large Power Users and Business SPU customers. The Citizen
Spacewell. (2023). Energy Efficiency in Supermarkets: How SUPERSPAR Despatch Cut Energy Costs by 24%. Used for the South African supermarket example, energy-management actions and reported savings. Spacewell
Supermarket & Retailer. (2021). Energy Savvy. Used for South African food-retail energy context, including refrigeration/HVAC, lighting, bakery loads and the importance of monitoring and managing electricity consumption. Supermarket